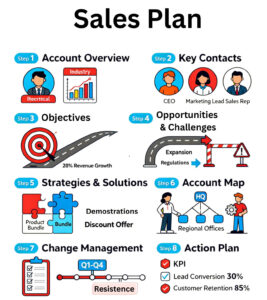
A Sales plan for key accounts should include structured sections to guide discovery, opportunity identification, solution proposals, and execution.

Key Sections of a Sales Plan:
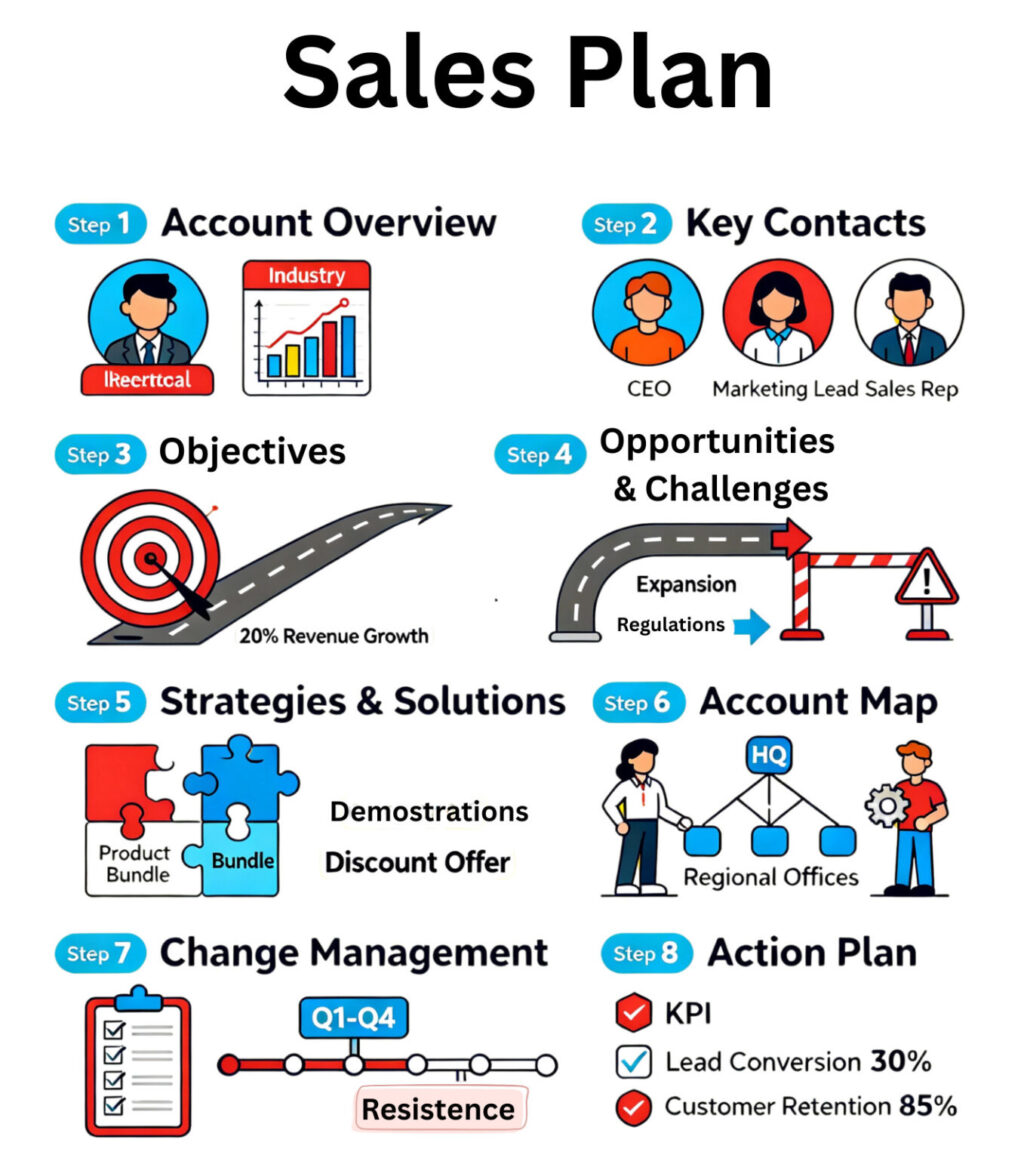
- Account Overview: Include client snapshot, industry details, revenue, relationship strength, and account history.
- Key Contacts: List decision-makers, influencers, and other stakeholders within the client organization.
- Objectives: Define top objectives or goals for the client, with aligned offerings and measurable success metrics.
- Opportunities & Challenges: Identify main issues, growth opportunities, and key obstacles the client faces.
- Strategies & Solutions: Propose tailored approaches and solutions, detailing how they align with the client’s goals and how success will be visualized after implementation.
- Account Map: Document an organizational chart of contacts, influencers, blockers, and champions to clarify internal dynamics.
- Change Management: Outline force-for-change and resistance factors, stakeholder involvement, training, and quick wins for early progress.
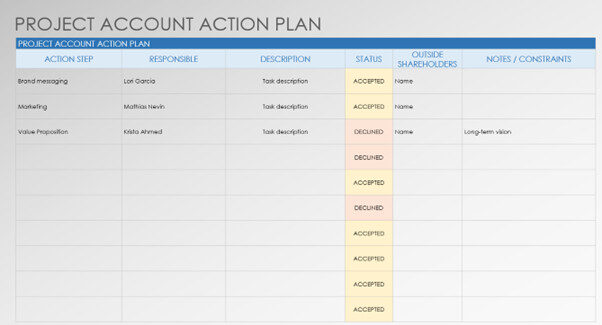
- Action Plan: Assign responsibilities, timelines, and KPIs for each strategic action, plus regular review and optimization schedules.